
All 17 apps and what their numbers mean#
Every number carries its unit. Two dashes (–) mean there is no value yet, usually because no drive is running. The board captures were taken on a bench with no car connected, so most of their values are dashes. The host renders show example values from a drive.
Drive#
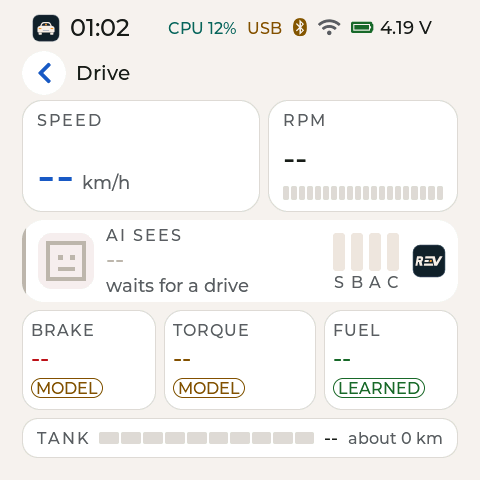
Drive, light theme, with R.E.V in use, before a car is connected.
The live view for the road.
Speed: road speed in km/h
RPM: engine speed, with a bar
AI sees: the model’s call on the last few seconds. Its four bars are S (stopped), B (braking), A (accelerating) and C (cruising). A mark at the right shows which model is in use.
Brake, Torque, Fuel: the model’s three estimates. A tag says where each number comes from. MODEL is the model’s estimate. LEARNED is a fuel figure R.E.V has learned in your car, shown only while R.E.V is in use.
Tank: the fuel level as a bar, and the range in km
End drive: hold it for 1 second. Logging stops, the drive is saved and its files are closed. A sheet shows each step and ends with Safe to unplug, or with the reason if a step did not finish. Logging then stays off, even while the car still answers, until you tap Start logging or the board restarts. See Stop logging and Turn off.
AI#
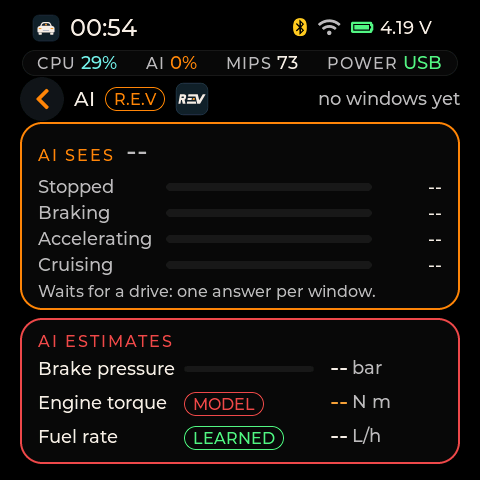
AI, dark theme, with R.E.V in use, before the first window.
What the model in use sees, in more detail.
AI sees: one bar each for Stopped, Braking, Accelerating and Cruising. The model gives one answer per window, a short slice of the drive. “No windows yet” means it has had no driving to look at.
Brake pressure: estimated brake pressure in bar
Engine torque: estimated engine torque in N m
Fuel rate: estimated fuel use in L/h (litres per hour)
Learning#
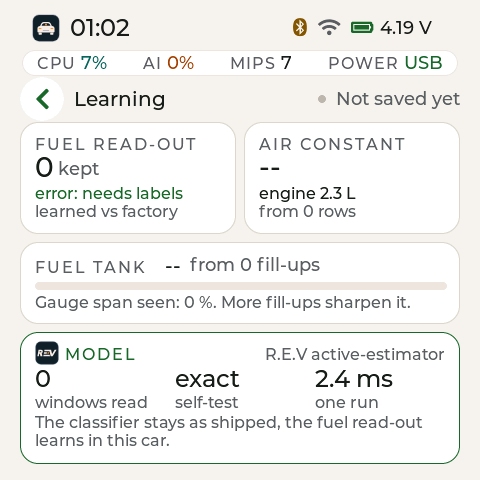
Left: Learning with R.E.V in use, on a new board: nothing learned yet. Right: Learning with E.V in use. Learning is off. Host render of the 2.0.0 screen code with example values.
What R.E.V has learned in your car so far.
Fuel read-out: how many learned updates R.E.V has kept for its fuel figure, and how it compares with the factory figure
Airflow constant: a number R.E.V learns from your engine, shown as an engine size in litres, and how many rows it came from
Fuel tank: the tank size learned from your fill-ups, and how much of the fuel gauge’s range it has seen. More fill-ups make it sharper.
Model: the model in use, the windows it has read, its self-test result and the time for one run in ms
Saved: the top right says “Saved on the board” or “Not saved yet”
While E.V runs, the cards are dimmed and the page says “Learning off: E.V in use”. R.E.V keeps what it learned.
R.E.V and E.V#
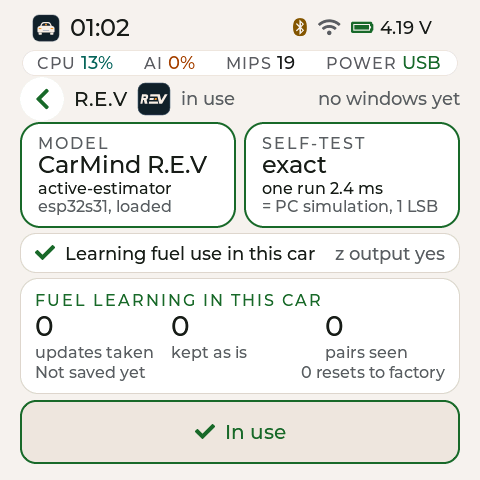
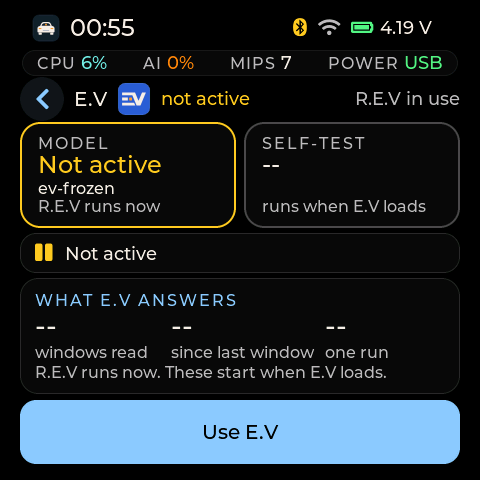
Left: R.E.V, in use, on a new board. Right: E.V, dark theme, while R.E.V is in use.
One app per model, side by side on the launcher. Each shows the model’s name, its file, its self-test and its own figures. The file shows by name: “active-estimator” for R.E.V and “ev-frozen” for E.V.
Self-test: at start the board checks the model against known answers. “exact” means it matched. “One run” is how long one answer takes.
R.E.V figures: fuel learning in this car: updates taken, updates kept as is, pairs seen and resets to factory
E.V figures: what E.V answers: windows read, time since the last window and one run. E.V runs as shipped, with no learning.
Use button: a 64 px “Use R.E.V” or “Use E.V” button. It reads “In use” for the model running. It works only while parked (see The two models).
Summary#
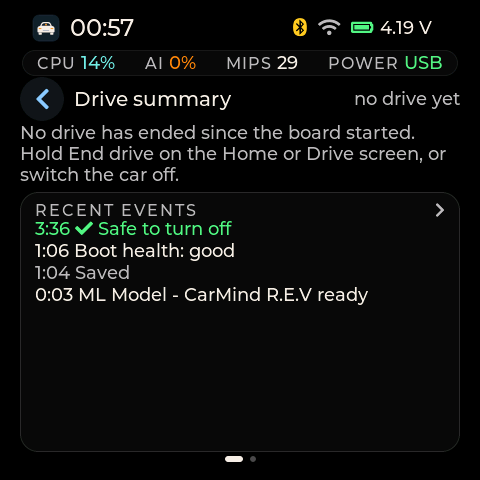
Summary before the first drive, dark theme.
The last drive, and the board’s events.
The drive: distance, time, economy and the hard-brake count
Charts: a speed and fuel chart, and what the AI saw every 10 seconds
History: charts of the last drives, oldest at the left: L/100 km and km per drive
Recent events: the board’s event list, newest first. Errors are red, warnings amber, and “Safe to turn off” is green.
The events log. Tap the events card to open the full list. Filter it with the chips All, Warnings, Errors, Wi-Fi and Drive. Tap a row to open its detail. The list keeps the newest 10 events since the board started. Each drive also keeps its own newest 24 events in its files, so the Drive filter still shows them after a long drive or a restart. The health check and the battery protection write their messages here too (see Health checks and messages).
After a restart the Summary shows the last drive again, read back from its files. The charts are not kept.
Live#
Live, light theme, during a drive. Host render of the 2.0.0 screen code with example values.
Values straight from the car, with no model in between.
Speed, Engine: road speed in km/h and engine speed in rpm
Throttle: how far the throttle is open, in %
Engine load: how hard the engine is working, in %, as the car reports it
Coolant: engine coolant temperature in °C
Fuel level: the tank level the car reports, in %
Adapter: the voltage the adapter measures at the OBD-II port, in V
Row rate: how many rows per second the board logs, in Hz, or “no data”
Fuel#
Fuel, dark theme, with R.E.V in use. Host render of the 2.0.0 screen code with example values.
Fuel use now and for this drive, and how your fill-ups correct it.
Source tag: top right: where the fuel figure comes from. NO SOURCE means there is none yet.
Fuel rate now: fuel use in L/h
Use now: the same figure as economy, in L/100 km
This drive: economy for this drive in your chosen unit (km/L here)
Fill-ups: the correction factor from your fill-ups. 1.00 means no correction yet.
Learner vs factory: how far R.E.V’s learned fuel figure and the factory figure are from the car’s own reading. It is off while E.V runs.
Brakes#
Brakes and torque, dark theme, after a minute of driving. Host render of the 2.0.0 screen code with example values.
The app title reads “Brakes and torque”. Two traces cover the last 60 s.
Brake pressure: the model’s estimate in bar, with the count of brakings and hard brakings this drive
Engine torque: the estimate in N m. The tag says MODEL for the model’s estimate, or PHYSICS when the board works torque out from the fuel and the engine size R.E.V learned.
Source line: the line under the torque trace names the source, for example “E.V estimate (no physics torque yet)”
Trip#
Trip, dark theme, during a drive. Host render of the 2.0.0 screen code with example values.
This drive so far. The top right says “Logging” during a drive and “Not in a drive” between drives.
Distance: km driven this drive
Engine on: how long the engine has run
Avg speed: average speed in km/h
Fuel used: litres used this drive
Economy: this drive’s economy, in your chosen unit
Session: the drive’s number (sNNNNNN) and how many rows it has logged
When the drive ends: a reminder: hold End drive for 1 second, and the Summary opens with the graphs
Engine#
Engine, dark theme, during a drive. Host render of the 2.0.0 screen code with example values.
The engine computer’s own sensor readings.
Trouble codes: the count of stored, pending and permanent codes, read once the car answers. The top right shows the MIL (check-engine light) state.
Battery: the car’s battery voltage in V
Intake air: intake air temperature in °C
Airflow: the airflow sensor reading in g/s
Manifold: intake manifold pressure in kPa
Short and long trim: the engine computer’s fuel corrections in %
Faults#
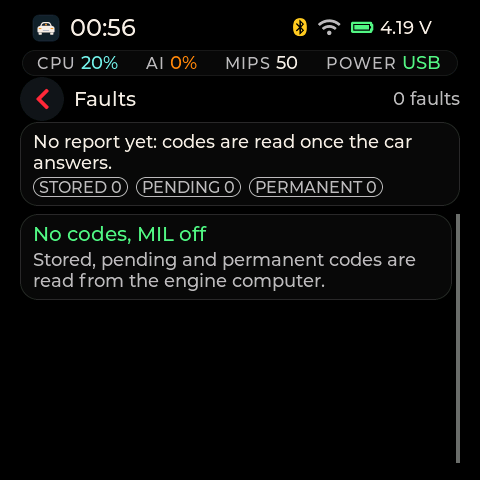
Faults, dark theme, no codes.
The trouble codes from the engine computer, in three kinds.
Stored: confirmed faults
Pending: faults seen once but not confirmed yet
Permanent: codes the car keeps until its own checks pass
Status line: “No codes” or the code count, and the MIL state
The board ranks the codes by severity and groups codes that share a cause, so several codes from one problem show together. See Alarms and faults.
Board#
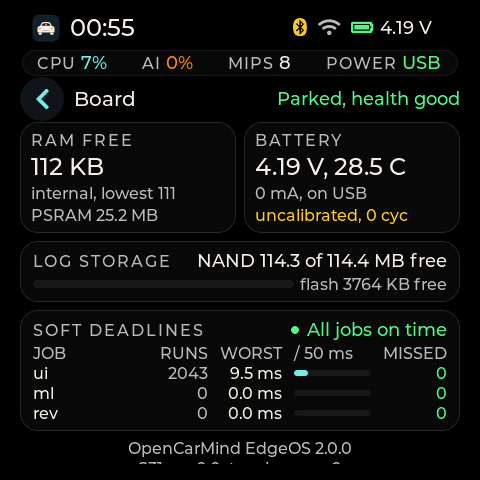
Board, dark theme, parked with health good.
The board’s own health, for checks and bug reports. The page scrolls: the RAM and battery cards, log storage and the first deadline rows fill the screen, and the rest of the table and the footer follow below.
Firmware: the firmware version, and the chip with its revision (“S31 rev” and a number)
RAM free: free internal memory in KB, the lowest it has been since start, and free PSRAM in MB
Battery: the cell’s voltage in V, its current in mA, “on USB” or “on battery”, and the temperature the fuel gauge measures, in °C. The line below says “uncalibrated” with the charge cycle count until the gauge is set up for this cell. It shows a battery protection state instead when one is active (see Health checks and messages).
Log storage: free space on the NAND in MB, and on the flash in KB
Soft deadlines: the scheduler’s job table: each job’s runs, its worst run and how many times it missed its deadline. “All jobs on time” means no misses.
Touch errors: how often the touch controller failed to answer
Header: at the top right, the board state and its health, for example “Parked, health good”. Green means good, amber degraded, red bad. During the first minute after a start it says “health pending”. Health checks and messages explains it.
Footer: two centred lines at the end of the scroll: the firmware version and the touch errors
Health#
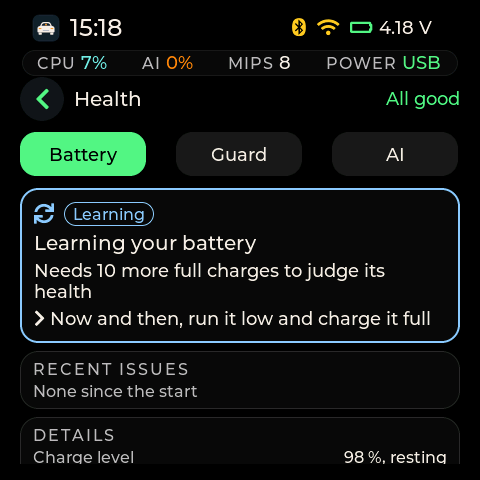
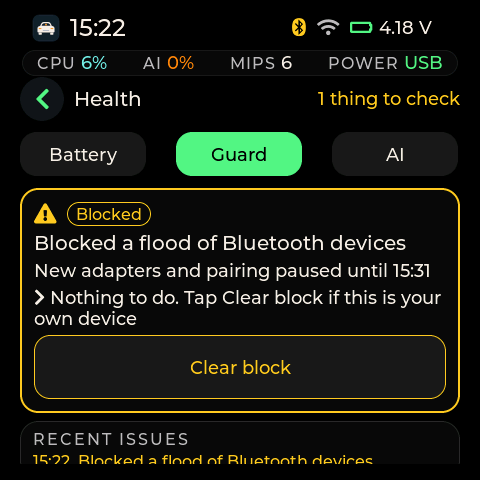
Health on the board: the Battery page while it learns the cell (left), and the Guard page in a test state that shows a block (right).
Health shows how the board itself is doing, on three pages. Tap Battery, Guard or AI under the title to switch pages. Swipe left or right to go to the next app, as everywhere. Nothing on this app changes a setting. The one button, Clear block, appears only while the guard is blocking.
The header counts what needs you: “All good” in green, or “1 thing to check” and “2 things to check”. The count is amber when the worst one can wait and red when it needs you now. Learning and slowing down on purpose are not counted.
The status card. Each page opens with one card:
A colour, an icon and a word: green “Good”, blue “Learning” (or “Starting”, “Slowed”), amber “Check soon”, red “Act now”. The word is there so you do not have to rely on the colour.
A headline, for example “Battery is healthy”.
One line on what it means, for example “Holds 98 % of its rated charge”.
One line on what to do, or “Nothing to do”.
Recent issues. The last five issues of the page with their time, newest first, and the line that says when one ended, for example “Block lifted”. It says “None since the start” until there is one. The list starts again after a restart.
Details below the card are for checks and bug reports. Scroll down to see them all.
Battery: what the card can say
Card |
What it means |
What to do |
|---|---|---|
Battery is healthy |
Holds 98 % of its rated charge (counted on a full charge), or “about 97 % of its starting charge” from the small model |
Nothing |
Learning your battery |
It needs n more full charges to judge its health |
Now and then, run it low and charge it full. A charge counts when it starts below about 3.6 V and ends full. A top-up does not count |
Battery is wearing out (amber) |
It holds less than 80 % of its charge, so it runs shorter on battery |
Plan to replace the cell |
Battery is worn out (red) |
It holds less than 70 % |
Replace the cell soon |
Battery warms up more than usual (red) |
It runs warmer than its load explains |
Let it cool, keep it out of the sun |
Battery loses charge while resting |
Its voltage falls with nothing drawing power |
If it keeps happening, replace the cell |
Battery current reading looks wrong |
A current shows while the board rests |
Check the battery connector |
Voltage drops more under load |
The battery’s resistance went up |
If it keeps happening, replace the cell |
Board draws more power than usual |
The battery empties faster than it learnt |
Check what is plugged into the board |
Connection to the battery glitches |
Some battery readings jump or go missing |
Check the battery connector |
Battery charge reading drifts |
The charge level and the voltage disagree |
Charge it fully once so it can reset |
The last seven come from the anomaly detector. It learns your cell’s normal for 24 hours, then looks at nine things once a minute. When it raises an alarm, the card names the one that looks most unusual. It never switches anything off.
Battery details: the charge level and mode (resting, on battery, charging, topping up), the current (“resting, 0 mA”, “charging +12 mA” or “on battery -118 mA”), power and temperature, the health estimate and where it comes from, the resistance against its first value, the unusual-behaviour check (“learning, 3.2 of 24 h”, “normal” or the alarm), its score against the alarm level, and the detector’s last message.
Guard: what the card can say
Card |
What it means |
What to do |
|---|---|---|
Learning this place (1.2 of 2 h) |
The first two hours after a start |
Nothing. It blocks nothing yet |
No threats seen |
Watching Bluetooth and Wi-Fi around the car |
Nothing |
Blocked a flood of Bluetooth devices (amber) |
New adapters and pairing paused until 14:12 |
Nothing. Tap Clear block if this is your own device |
Blocked a flood of Wi-Fi networks, or a Wi-Fi disconnect attack (amber) |
Clock sync over Wi-Fi paused until 14:12 |
The same |
An adapter that looks like yours behaved differently (amber) |
Its data is kept out of learning |
Check that the adapter in the car is yours |
Car link answers slower than usual |
Its data is kept out of learning |
Nothing |
Saw a flood of … |
Blocking is off in Settings, so nothing was paused |
Turn on blocking in Settings to pause it |
Guard details: the mode, adapter checks, re-pair requests refused, clock jumps refused and blocks today, one score bar per check (Bluetooth, car link, Wi-Fi, the mark is the limit, “no data” when the check has nothing right now), and the guard log with its last three messages. The first Wi-Fi scan after a start has nothing to compare with, so it is not scored.
AI: what the card can say
Card |
What it means |
What to do |
|---|---|---|
All AI features on time |
Battery and guard checks run in the background |
Nothing |
Board busy: AI features slowed (or paused) |
Keeps the screen and the drive log smooth |
Nothing |
AI features mostly on time |
n runs finished late since the start |
Nothing |
Some AI features are off (amber) |
One of them did not pass its start check |
Restart the board once |
AI features starting |
They start once the board has booted well, about a minute after a start |
Nothing |
AI details: the degradation ladder, the worker’s core, and one card per feature (Battery charge, Battery check, Network guard) with its runs, late runs and skipped runs, “worst time 12.9 ms (limit 1,000 ms)”, the longest a run took from its start time to its end, against its deadline, and “work per run 0.23 ms (budget 2 ms)”, the longest a run computed, against its time budget.
The banner. When a battery wear, a battery alarm, a guard block or an adapter question starts, the banner shows “Check soon” or “Act now”, the headline and Open Health. Tap it to open the right page. Swipe it away to just close it. While you drive, amber issues only go into the list, and red ones show for 10 seconds. On Home, the Health icon gets an amber or red dot while an issue is active.
Files#
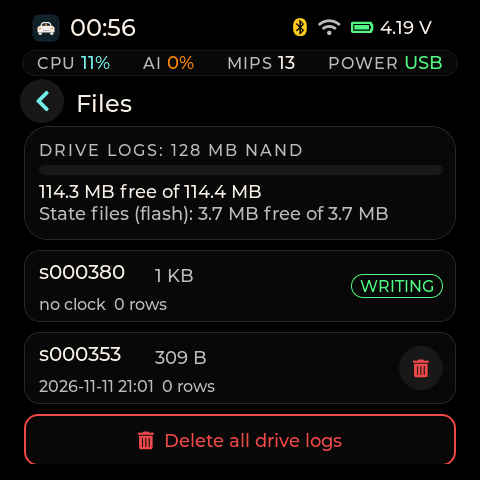
Files, dark theme, with the drive logs on the 128 MB NAND.
The drive logs on the board.
Storage: free space on the drive store
Each drive: its session number, size, rows and date. “no clock” stands in for the date when the clock was not set during that drive.
WRITING: the drive being written now. You cannot delete it.
Delete: the bin button. A confirm sheet always asks first.
Delete all: removes every drive log. It asks twice, because you cannot undo it.
Wi-Fi#
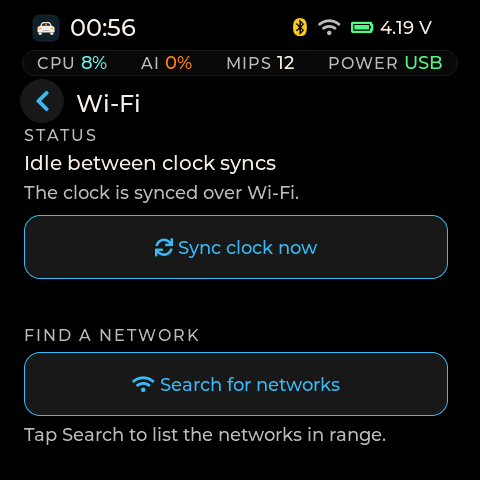
Wi-Fi, dark theme, idle between clock syncs.
Search, join and the clock sync. The radio is off unless one of these is running.
Status: what Wi-Fi is doing, and whether the clock has been synced over Wi-Fi
Sync clock now: sets the clock now from a saved network. With none saved it says “No saved network yet: search and join one first.”
Search for networks: lists the networks in range so you can join one
Saved networks: the networks the board knows (up to 8), each with Forget. The note under the list says “The board uses them only to set its clock.”
Wi-Fi covers searching and joining.
Settings#
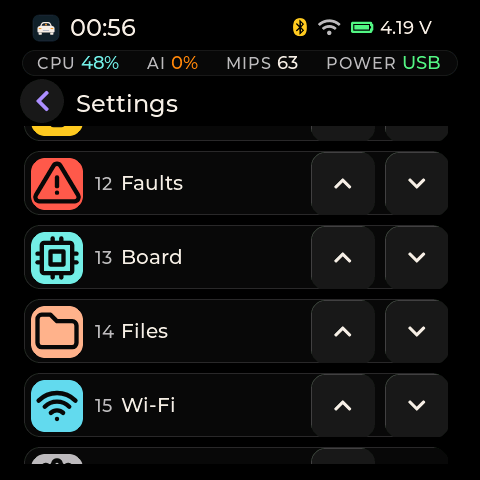
Settings, dark theme: the Home apps order.
One scrolling list of everything you can change.
Look: brightness and the theme (Auto, Light or Dark)
Model: R.E.V or E.V, switched only while parked
Clock: where the time came from, and Set clock
Units: economy in km/L or L/100 km
Screen: screen off after a time, and the order of the apps
Logging and power: Stop logging (Start logging once stopped) and Turn off
OBD adapter: Find OBD adapter and Forget adapter
Storage: Format storage
Firmware: the version, the chip, the flash and PSRAM size
Settings goes through each one.